
You have chosen a beach, checked the forecast and packed the flask. Then you open the local tide table and find a grid of abbreviations, decimal numbers and dates that seems to assume you already know what you are doing. The good news is that a tide table is a simple document once you know how it is laid out. A couple of minutes spent reading it the right way round will tell you when the water will be at its highest, when it will be at its lowest, and roughly how much sand you can expect under your feet.
Here is how to make sense of one, column by column.
A tide table is a prediction of water levels at a specific place, usually covering a year or a month and broken down day by day. Most UK tables give you four lines per day: two high waters (often marked HW) and two low waters (LW), each with a time and a height. Some list only the higher high water and lower low water, which is fine for most beach plans but less useful if you are timing a walk along a causeway.
Treat it as a very good forecast rather than a promise. Air pressure, wind and other weather can shift the timing by several minutes and change the actual height of the water, sometimes noticeably. The table gives you the astronomical tide; the weather adds its own twist on the day.
Most of the confusion around tide tables comes from two things that have nothing to do with tides at all.
UK tables use the day/month/year order, so 03/05 means 3 May, not 5 March. If you are reading a table on a foreign or international site, check which convention it uses before you plan anything. This sounds trivial until you turn up a month early.
Many UK tide tables are published in GMT all year, even in summer, and state this in the small print at the top or the bottom. Others switch to BST between late March and late October. If a table gives high water as 09:00 and the times are in GMT, that is 10:00 on your watch during British Summer Time. Arriving an hour out can mean the difference between a shallow paddle and a swim, so look for the time zone every single time.
Times are written on the 24-hour clock. 14:30 is half past two in the afternoon; 00:15 is a quarter past midnight, at the very start of that day.
Heights are given in metres, measured above chart datum. Chart datum is a low-water baseline used for navigation charts, roughly the level of the lowest predictable tides, which is why the figures are usually positive numbers. It is not the same as mean sea level, so do not expect the numbers to match what you see on a map.
The useful bit is the difference between high and low. If high water is 4.2 m and the following low water is 0.6 m, the range is 3.6 m. A large range means a lot of beach appears at low water and disappears again by high water. A small range, perhaps only a metre or so, means the sea stays roughly where it is and your favourite rock pool may never fully uncover.
The range does not stay the same from week to week. Around the new and full moon, the sun and moon pull roughly in line and you get spring tides: the highest highs and the lowest lows. Around the quarter moons you get neap tides, with a much smaller range.
If your plan depends on a particular feature appearing — a sandbar, a cave entrance, a causeway — check whether the day falls near springs or neaps before you set off.
Tide tables are calculated for specific locations, often called standard ports. If your beach is not one of them, the table may offer a secondary port correction: a time difference in minutes and a height difference, to be added or subtracted from the standard port figures.
These corrections are worth using. A table for a port twenty miles along the coast can be half an hour or more out for your bay, and local shape matters enormously — a long estuary or a shallow bay can behave quite differently from the open coast nearby.
Here is an illustrative daily extract, the sort of thing you will see in a printed table:
Thursday 12 June
LW 03:07 0.8
HW 09:26 4.1
LW 15:33 0.9
HW 21:48 4.0
Reading it in order: the water is lowest in the early hours, rises to a high of 4.1 m mid-morning, drops to another low in the mid-afternoon, then rises again in the evening. The range is about 3.3 m, so there is plenty of movement. If you want to explore rock pools or walk out to a sandbank, the mid-afternoon low is your window — aim to be there from about an hour before 15:33 and be heading back by around 17:00. If you would rather swim in deep water off the beach, the late morning high is the better slot.
Do the same thing for your own date:
Check the table the day before and again on the morning you go, because weather can nudge the real thing away from the prediction. Low pressure and a strong onshore wind tend to push water higher than forecast; high pressure and offshore winds often keep it a little lower.
None of this replaces proper local advice, particularly if you are planning to launch a boat, fish from rocks, or walk a route where the tide matters for your safety. Use the table as one input among several, alongside the weather forecast and the guidance of people who know the area. Get into the habit of reading the numbers before you pack the car, and a day at the coast becomes far easier to plan — and far more enjoyable once you are there.
Photo: panumas nikhomkhai / Pexels
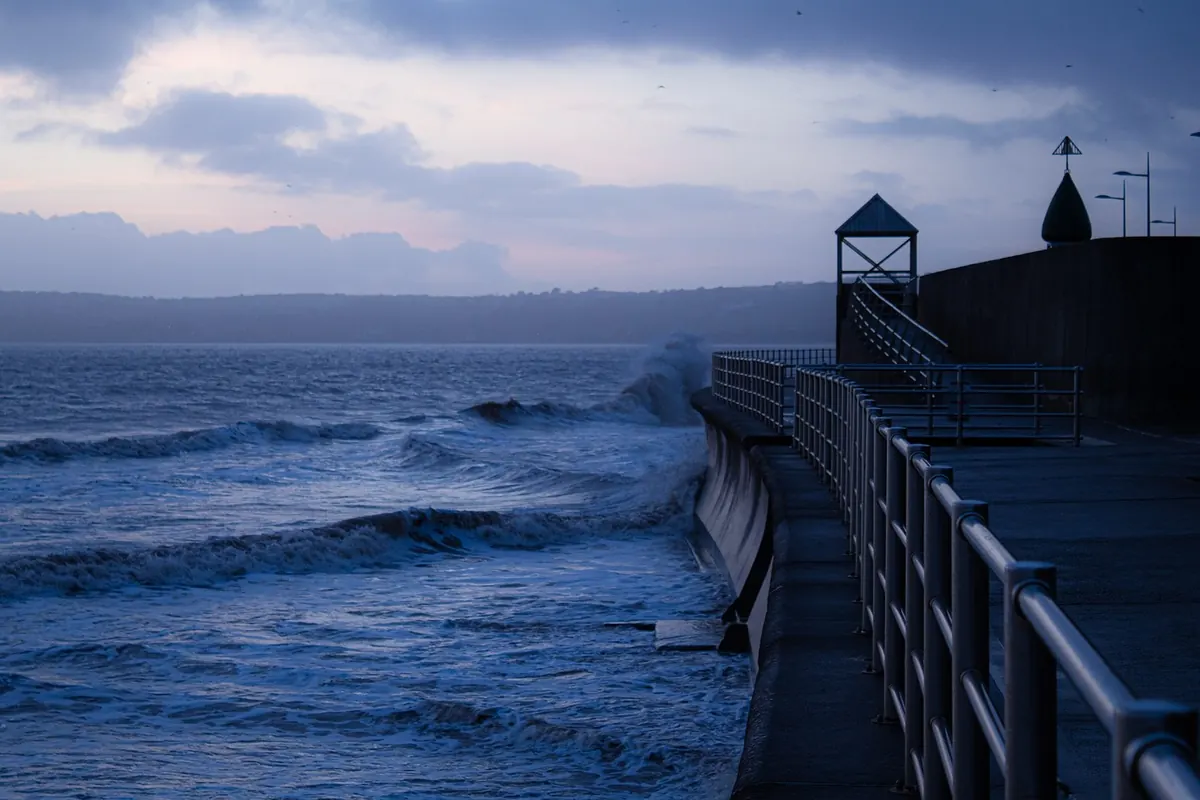
Combine tide tables, storm surge forecasts and official weather warnings to judge winter coastal flood risk — plus a...
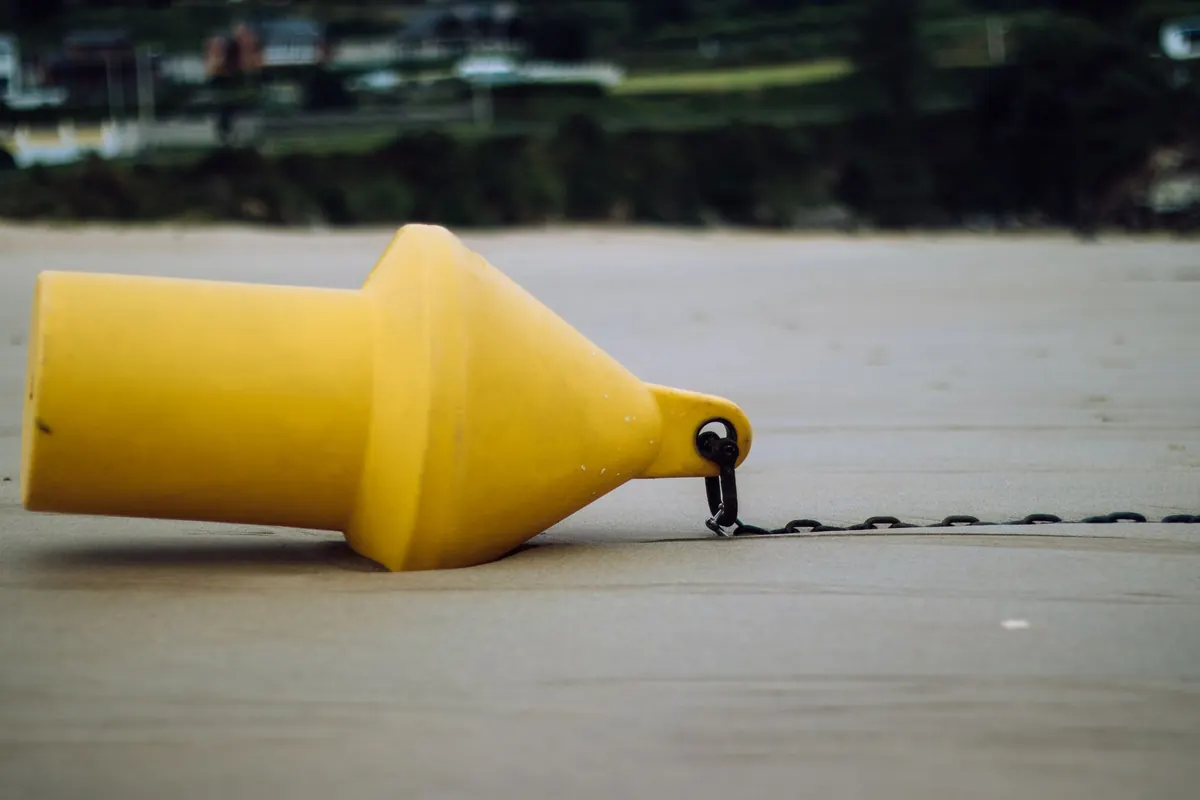
Chart datum is the baseline behind every UK tide height. Here's how to read predictions properly, add them to...

A practical checklist for dog owners on UK coasts and estuaries, covering tide tables, the rule of twelfths, cut-off...


Your daily guide to tides and coastal conditions.
