You check one source and high water at the harbour is 10:42. You check another and high water at the beach is 10:18. Neither is wrong. They are describing the tide in two different places, and knowing which one to trust for your particular plan takes about two minutes once you understand what each is doing.
A standard port — Portsmouth, Liverpool, Newlyn, Aberdeen — has a tide gauge that has been recording for decades. Those records produce harmonic constants: a set of numbers describing how the moon, sun and local geography combine to move water at that precise spot. Port tables are built from that. They are dependable, consistent and they underpin the Admiralty Tide Tables.
The catch is where the gauge sits. Usually it is in a harbour, behind a breakwater, in a dredged channel, or a mile or two up an estuary. That is real water at a real place, but it is not your beach. A port table is a very good answer to the question "what is the tide doing at the port?" It is only an approximate answer to "what is the tide doing where I am standing?"
A beach forecast usually comes from one of two places. It may be a secondary port calculation: the standard port's predictions with a fixed time difference and height difference applied. Or it may come from a computer model that divides the coast into small grid squares and calculates the tide in each one, often pulling in wind and air pressure as well.
Good beach forecasts also do something port tables rarely bother with: they tell you about the shape of the shoreline, wave height, and how far up the beach the water is likely to reach. If you are planning to walk round a headland, launch a kayak or cross a causeway, that is the information you need.
Differences of twenty minutes to an hour are entirely ordinary along a stretch of coast, and heights can vary by tens of centimetres. Three things cause most of it.
The tide is a wave travelling around the British Isles, and it takes time to get from one place to another. On top of that, funnel-shaped coasts and estuaries amplify it. The same incoming tide that produces a modest rise at an open bay can push a metre higher where the coastline narrows.
In shallow water, the tide behaves differently from the deep channel where a port gauge often sits. Sandbanks, channels and river flow all bend the curve. A strong run of rain can hold back the ebb in an estuary for an hour or more, while the port table knows nothing about it.
Air pressure and wind move water around. As a rough guide, every hectopascal below average pressure lifts the water by about a centimetre, and a sustained onshore wind can pile water against the coast. Offshore wind does the opposite, holding the water back. This is why a beach prediction that includes the forecast for the day can beat a table printed a year in advance — and why on a windy day, both can be out.
For a general day out, the port table is fine. For these situations, use the nearest beach-specific prediction you can find, and check it against the port:
If you are planning a walk an hour either side of low water on a beach a mile or two from the port, with no headlands to round and no channels to cross, the port table will serve you well. It is also the better choice for anything formal — marina bookings, harbour dues, mooring plans — because harbour authorities work from it. Consistency has value.
Use the beach-specific prediction as your working number and the port table as your sanity check. If they agree within about fifteen minutes and a few centimetres, relax. If they disagree by more than half an hour, assume the less convenient of the two and give yourself a margin. And remember that the height matters as much as the time: on a gentle beach, a low high water can leave you far more room than a slightly earlier one.
For anything safety-critical — crossing a causeway, launching a boat, rounding a headland — no app replaces a local tide table plus a look at the sea, a check of the wind, and a word with someone who knows the beach. If being cut off or caught out would put you or anyone with you in danger, plan for the tide to be worse than predicted, and have a way out that does not depend on the water behaving itself.
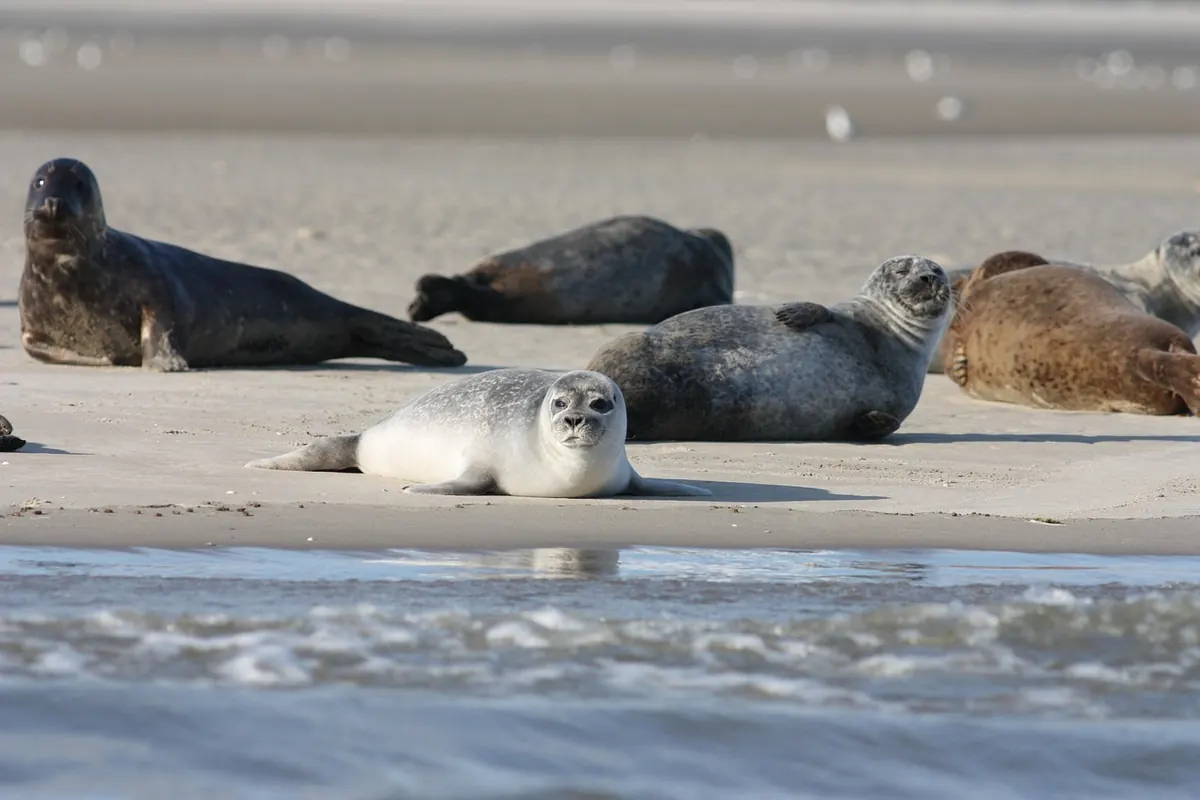
Photo: Alicia_Chant / Pixabay
Combine tide tables, storm surge forecasts and official weather warnings to judge winter coastal flood risk — plus a...
Chart datum is the baseline behind every UK tide height. Here's how to read predictions properly, add them to...

A practical checklist for dog owners on UK coasts and estuaries, covering tide tables, the rule of twelfths, cut-off...


Your daily guide to tides and coastal conditions.
